
In my “Introduction to Programming in Python” course, I formalized several assignments into projects this semester. The fifth project follows a Text Adventure game and precedes the final project, both of which are fairly difficult. I wanted this fifth project to be a bit lighter and interesting, while still providing some opportunity for critical thinking. The theme of the associated modules was Data Science, so I came up with the following prompt and project requirements:
For this project, you will be conducting your own data science analysis of a dataset of your choosing. You are empowered to find a dataset that interests you. The final product of your analysis will be a Jupyter Notebook with some explanations and the results of your computation alongside the code.
- Clearly identify the source of the dataset and objectively explain the importance of the data
- Load (and potentially process) the dataset with good code organization
- Create a properly labelled histogram with at least 30 data points and clearly interpret your Histogram
- Perform an additional statistical, visual, or other Data Science analysis and clearly explain the results of your secondary analysis
- Clearly identify 2 stakeholders and what they should learn from the results
Jupyter Notebooks are awesome, and I’m pleased students get an opportunity to work with them. The last coding exercise in the course has them reconstruct a given Jupyter Notebook - the autograder in BlockPy then checks that it has all the necessary components with the right formatting. I don’t know how students felt about this assignment, but it seemed effective in quickly teaching them how to use markdown.
For the project, students were given wide range to choose a dataset, as long as it met some minimal criteria. Basically, it needed to have 30 numeric data points, or enough data to be transformed into 30 numeric data points (suitable for a histogram). Here was the prompt:
You should find a JSON file to conduct your analysis on. There are many public repositories of JSON data, such as the CORGIS collection, which has a large number of JSON files from a variety of sources. Using a Google search, you can find many JSON files on the web that will be suitable for analyzing in Python. You can even convert a CSV. file or another data type to JSON (although you are on your own for using such tools). Any JSON dataset is suitable for your analysis. You could analyze historical data about diseases, battle logs from a video game, weather records in your home state, or whatever you please.
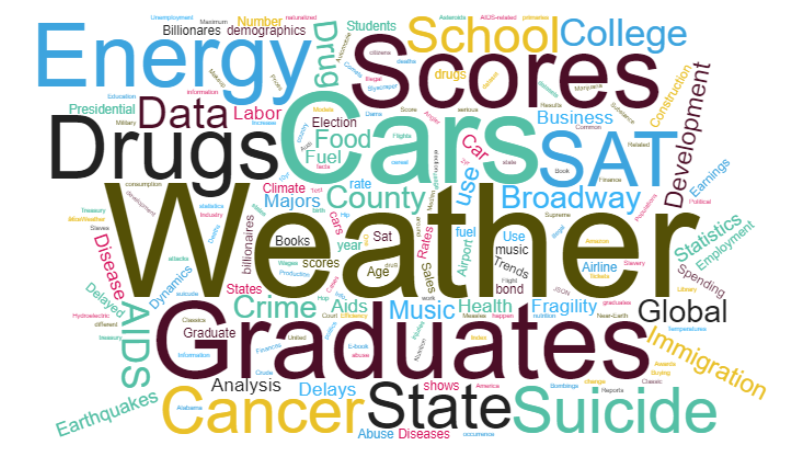
I wasn’t trying to box students in, but students almost universally chose to use CORGIS datasets. Some students had questions about the datasets, and in a couple cases I made suggestions to steer students, but by and large the 300+ students seemed pretty satisfied with what they found. The word cloud below is from a survey of what datasets they chose:
The CORGIS Dataset project was originally created to serve the Computational Thinking class. Having it fit in so naturally with the Introduction to Python class was very pleasing. Thinking about this audience, I do recognize some ways we might serve them better - the JSON documentation is pretty awful, for instance. And I was reminded many times this semester that some of these datasets need work: Cancer is a mess of a dataset, and Education is just plain busted.
I’m very excited about the project, but evaluations will speak more about this later. I look forward to posting a follow-up with some data about the project in comparison to the others.